Unlocking Python's Data Visualization Potential: Top 10 Libraries
Written on
Introduction to Data Visualization with Python
Hello, I’m Gabe, and I have a deep enthusiasm for sharing knowledge about Python and Machine Learning. With more than ten years of experience in data analysis and visualization, I have encountered various tools and techniques that make the process both effective and engaging.
In this article, I will introduce you to my favorite ten Python libraries that excel in data visualization.
1. Plotly: Interactive Visualizations Like Never Before
For creating interactive and visually striking visualizations, Plotly is my top recommendation. Its user-friendly interface and extensive feature set empower data analysts and visualization aficionados to vividly present their data.
Here’s how to create an interactive bar chart using Plotly:
import plotly.express as px
import pandas as pd
data = {'Category': ['A', 'B', 'C'], 'Value': [10, 15, 7]}
df = pd.DataFrame(data)
fig = px.bar(df, x='Category', y='Value')
fig.show()
2. Seaborn: Beauty and Simplicity Combined
When I need to produce aesthetically pleasing and insightful statistical graphics, Seaborn is my library of choice. Its elegant and concise syntax simplifies the creation of complex visualizations.
import seaborn as sns
tips = sns.load_dataset('tips')
sns.boxplot(x='day', y='total_bill', data=tips)
3. Matplotlib: The Classic Choice for Versatile Visualizations
Having stood the test of time, Matplotlib holds a special status among data analysts and visualization lovers. Its extensive capabilities and flexibility allow for a wide array of visualization types.
Here’s a simple line plot made with Matplotlib:
import matplotlib.pyplot as plt
x = [1, 2, 3, 4, 5]
y = [10, 8, 6, 4, 2]
plt.plot(x, y)
plt.show()
4. Altair: Declarative Visualization in a Snap
For those who appreciate concise and expressive coding, Altair is an excellent option. Its declarative style allows for rapid generation of impactful visualizations.
import altair as alt
from vega_datasets import data
cars = data.cars()
alt.Chart(cars).mark_circle().encode(
x='Horsepower',
y='Miles_per_Gallon',
color='Origin'
).interactive()
5. Bokeh: Interactive Visualizations for the Web
Bokeh is a fantastic choice for producing interactive visualizations intended for the web. Its capability to create interactive plots that can seamlessly integrate into web applications opens up vast possibilities.
Here’s an example of a scatter plot with tooltips using Bokeh:
from bokeh.plotting import figure, show
from bokeh.models import HoverTool
from bokeh.sampledata.iris import flowers
p = figure(title='Iris Dataset', x_axis_label='Petal Length', y_axis_label='Petal Width')
p.add_tools(HoverTool(tooltips=[('Species', '@species'), ('Sepal Width', '@sepal_width')]))
p.circle(x='petal_length', y='petal_width', size=8, source=flowers)
show(p)
The first video titled "7 Python Data Visualization Libraries in 15 minutes" provides a quick overview of essential libraries that enhance your data visualization skills.
6. ggplot: Harnessing the Power of R’s ggplot2
If you are a fan of the R programming language's ggplot2 library, you’ll appreciate ggplot for Python. It allows for the creation of visually appealing and highly customizable plots.
Here’s how to create a scatter plot using ggplot:
from ggplot import *
df = pd.DataFrame({'x': [1, 2, 3, 4, 5], 'y': [10, 8, 6, 4, 2]})
ggplot(aes(x='x', y='y'), data=df) + geom_point()
7. NetworkX: Visualizing Complex Networks
For those tackling complex networks, NetworkX is an invaluable library. It provides a comprehensive toolkit for crafting and analyzing networks, helping you derive insights from intricate structures.
Here’s an example of visualizing a social network using NetworkX:
import networkx as nx
import matplotlib.pyplot as plt
G = nx.karate_club_graph()
nx.draw(G, with_labels=True)
plt.show()
8. Wordcloud: Unleash the Power of Text Visualization
Text visualization plays a crucial role in data analysis, and Wordcloud is an excellent tool for this task. Its ability to create engaging and informative word clouds allows you to glean meaningful insights from textual data.
Here’s how to generate a word cloud from a text sample using Wordcloud:
from wordcloud import WordCloud
import matplotlib.pyplot as plt
text = "Lorem ipsum dolor sit amet, consectetur adipiscing elit."
wordcloud = WordCloud().generate(text)
plt.imshow(wordcloud, interpolation='bilinear')
plt.axis('off')
plt.show()
9. Pygal: Interactive SVG Charts
If you seek interactive SVG charts, Pygal is a superb choice. Its SVG-based visualization approach enables the creation of engaging charts that are easy to embed in web applications.
Here’s an example of producing a bar chart with Pygal:
import pygal
bar_chart = pygal.Bar()
bar_chart.add('Series', [1, 3, 2, 5, 4])
bar_chart.render()
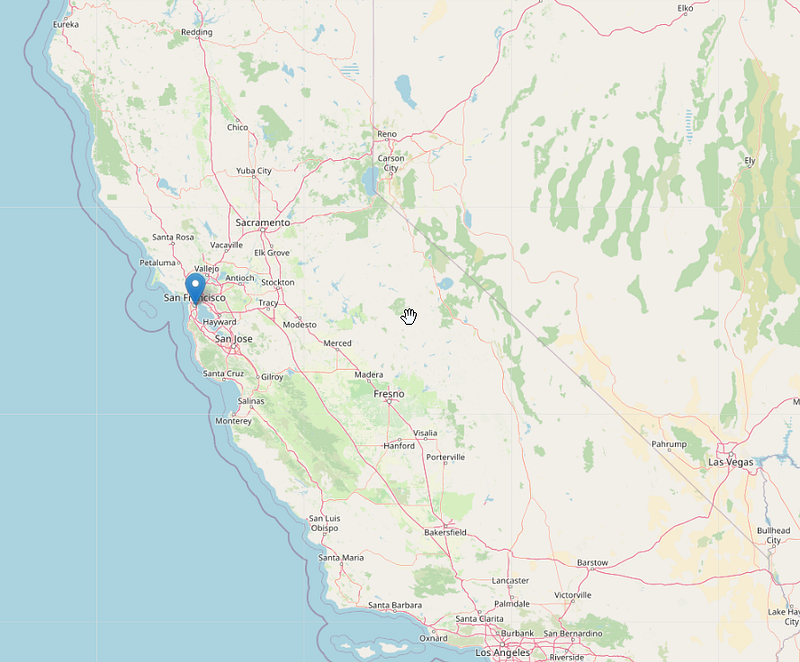
10. Folium: Maps Made Easy
Finally, if you are looking to create interactive maps, Folium is the library for you. Its seamless integration with leaflet.js makes it simple to develop visually appealing and interactive maps.
Here’s how to create a map with markers using Folium:
import folium
m = folium.Map(location=[37.7749, -122.4194], zoom_start=12)
folium.Marker(location=[37.7749, -122.4194], popup='San Francisco').add_to(m)
m

Conclusion: Embrace the Power of Python for Unforgettable Data Visualizations
In conclusion, equipping yourself with these ten Python libraries can elevate your data visualization capabilities significantly. From interactive plots to exquisite maps, these tools offer a wide range of options to express your creativity. Dive in, explore, and let your data narrate compelling stories.
Remember, “Visualize to Materialize: Unleash the Power of Python!”
I hope this guide proves useful to you. Thank you for reading!
The second video titled "Top 5 Python Libraries for Data Visualization (Ft. @CodingProfessor)" showcases essential libraries that enhance your data visualization techniques.